A warning before your streak breaks.
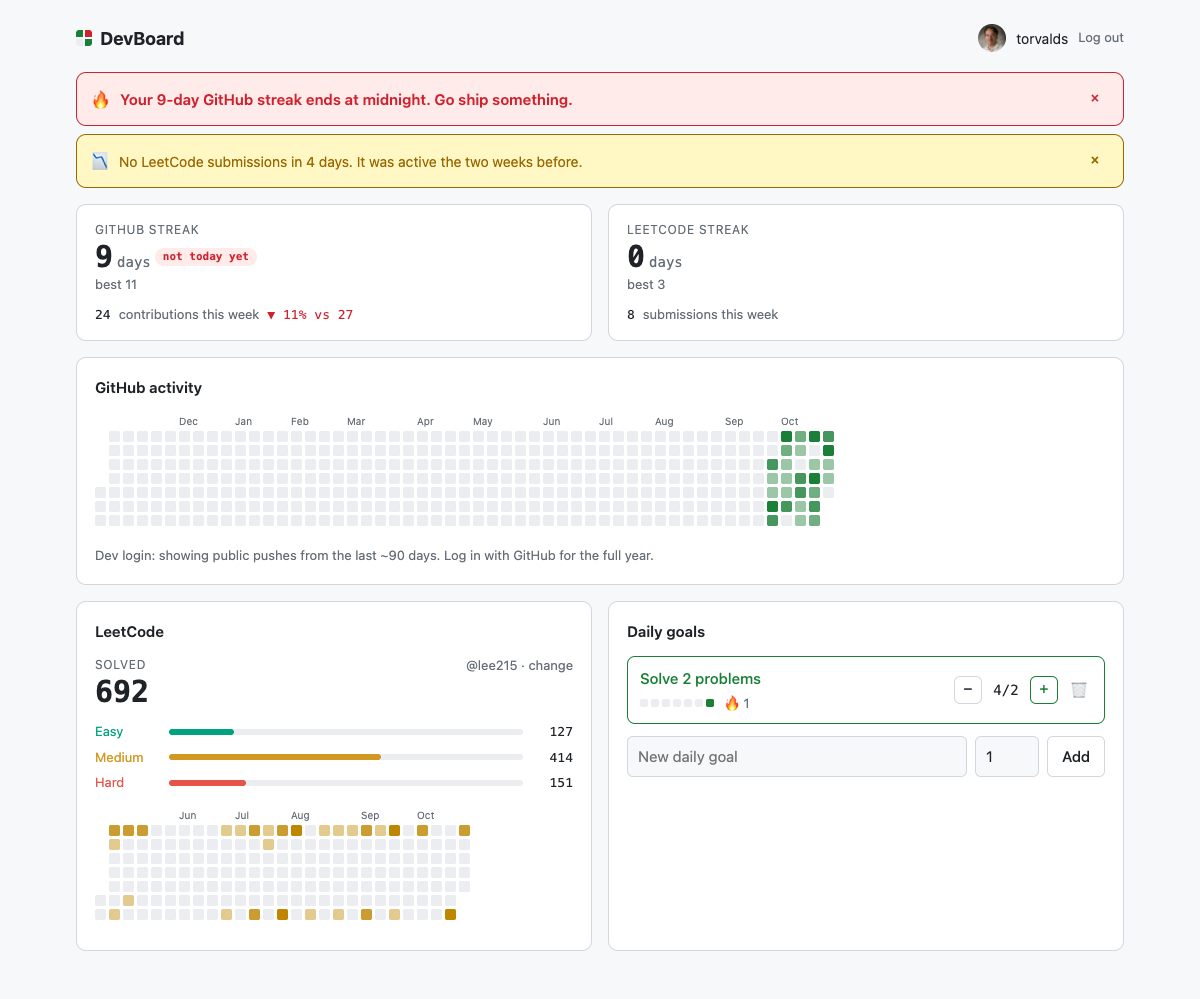
Most developer dashboards show today's numbers and stop there. DevBoard reads the trend: it pulls your GitHub contribution calendar and LeetCode history, tracks your own daily goals, and puts a banner on top when the pattern says you're slipping.
Log in with GitHub (read-only read:user scope). LeetCode only needs a public username.
It warns you before, not after.
Four rules run over every source, GitHub, LeetCode and each of your goals, and the most urgent one goes on top.
Streak ends today
A streak that is alive but has nothing for today gets a red banner: "Your 9-day GitHub streak ends at midnight." It uses your local date, which the browser sends, so it doesn't fire at the server's midnight.
Decline and flatline
This week against last week, and a quiet spell after a busy fortnight: "GitHub contributions down 46% week-over-week (28 → 15)."
Trend to zero
A least-squares line over the last two weeks projects when activity hits zero: "At this pace your LeetCode activity hits zero in about 2 days."
What it looks like
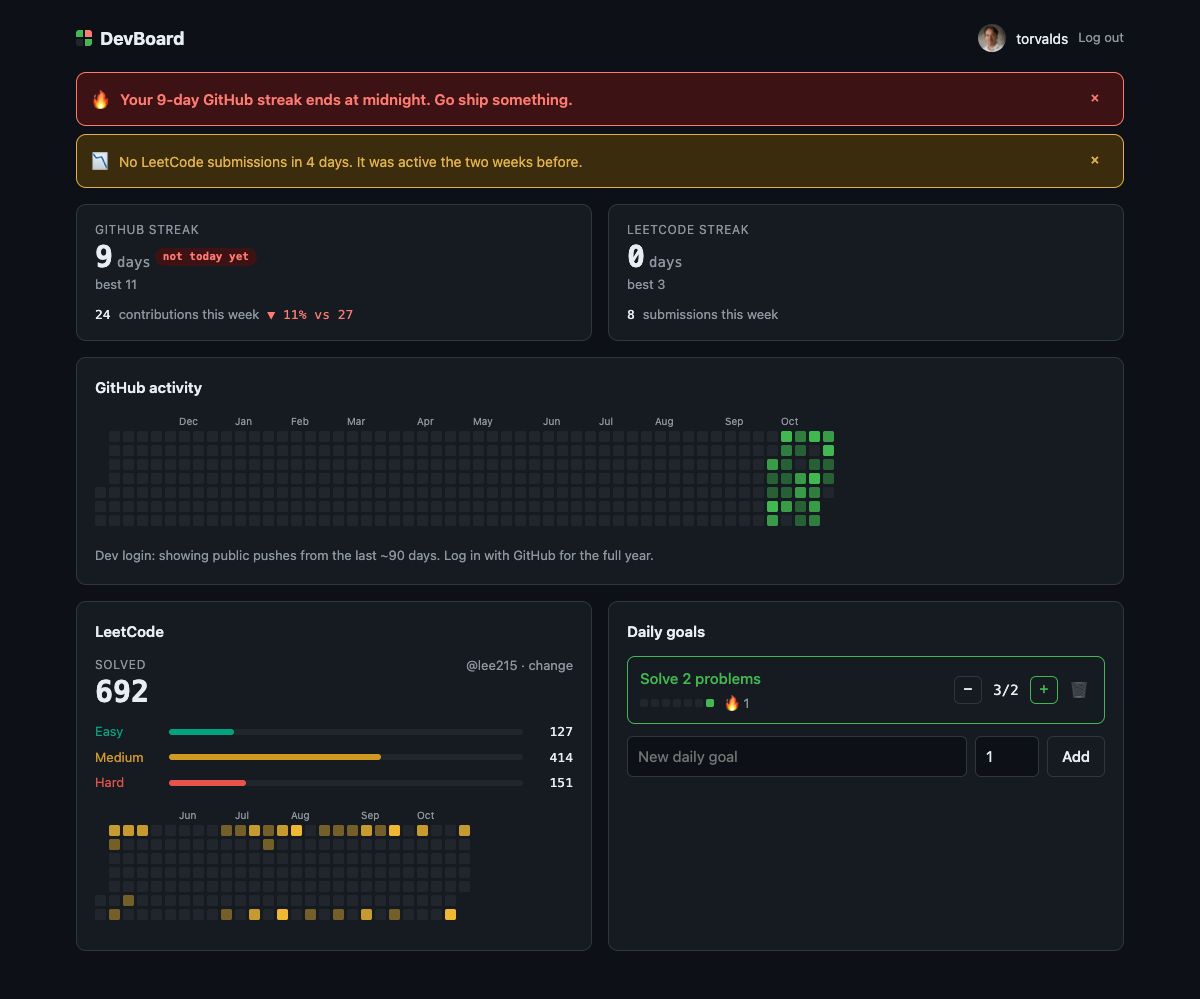
Streak cards with week-over-week change, a year of GitHub activity, LeetCode solves by difficulty and daily goals with their own streaks. Light and dark follow your system.
Key concepts & stack
Pure risk engine
risk.py takes {date: count} and returns alerts. No I/O, so one set of rules covers every source and the tests need no mocks.
The user's today
Every API call carries the browser's local date, so a streak doesn't "break" at 5:30 am for someone in India.
Sources fail alone
GitHub and LeetCode are fetched in parallel; if one is down, only its card shows an error.
Short-lived cache
Upstream responses are kept for ten minutes, so refreshing the page doesn't hit GitHub's or LeetCode's rate limits.
Hand-rolled heatmap
An SVG grid with levels from the data's own quartiles, so a quiet year and a busy year both show contrast.
Signed session cookie
GitHub OAuth with a state check, then an HttpOnly cookie signed with itsdangerous. The token never reaches the browser.
Run your own
No OAuth app needed locally: with DEV_LOGIN=true you can open the dashboard as any public GitHub username.
API
- 1Install and configure:
cd backend && uv sync cp .env.example .env - 2Start it on port 8000:
uv run uvicorn app.main:app --reload
App
- 1Install and start Vite:
cd frontend && npm install npm run dev - 2Open it:
http://localhost:5173